The FVt-diagram: May 2018 - Aug. 2022 (blank regions are periods without observational data)
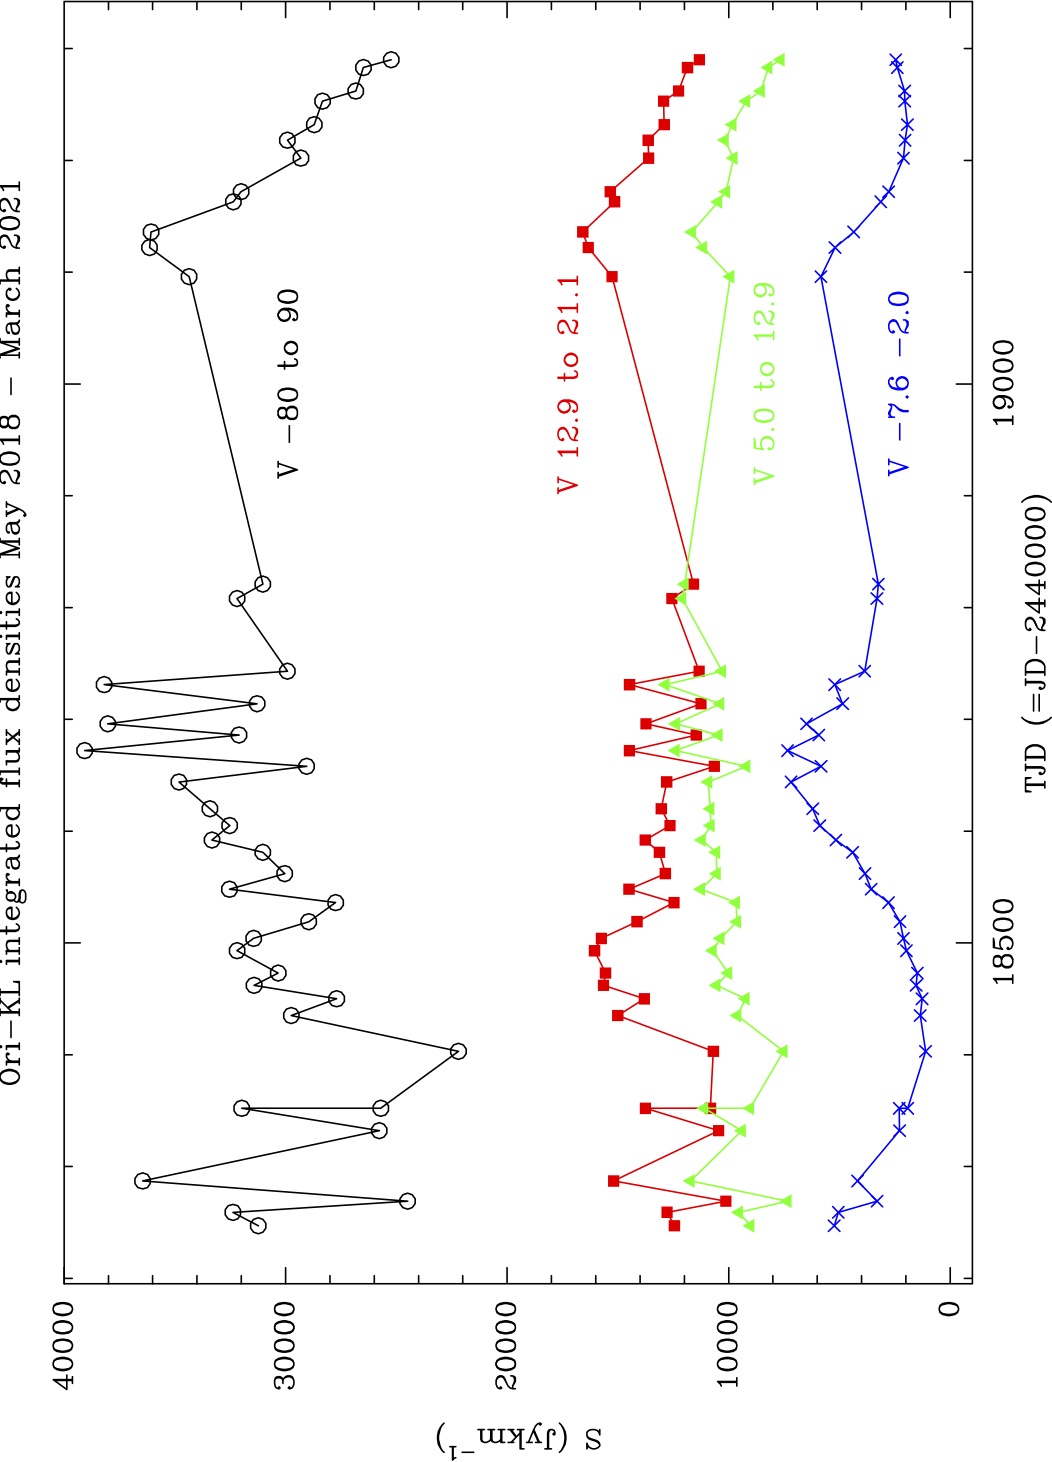
Integrated flux density versus TJD (days) for various spectral features in the Orion KL water maser profile. The integration limits in velocity are indicated for each curve. The time period shown is mid-May 2018 to mid-March 2021. Between Dec. 2019 and Sep. 2020 no data were taken (structural problems antenna and covid-19 lockdown).
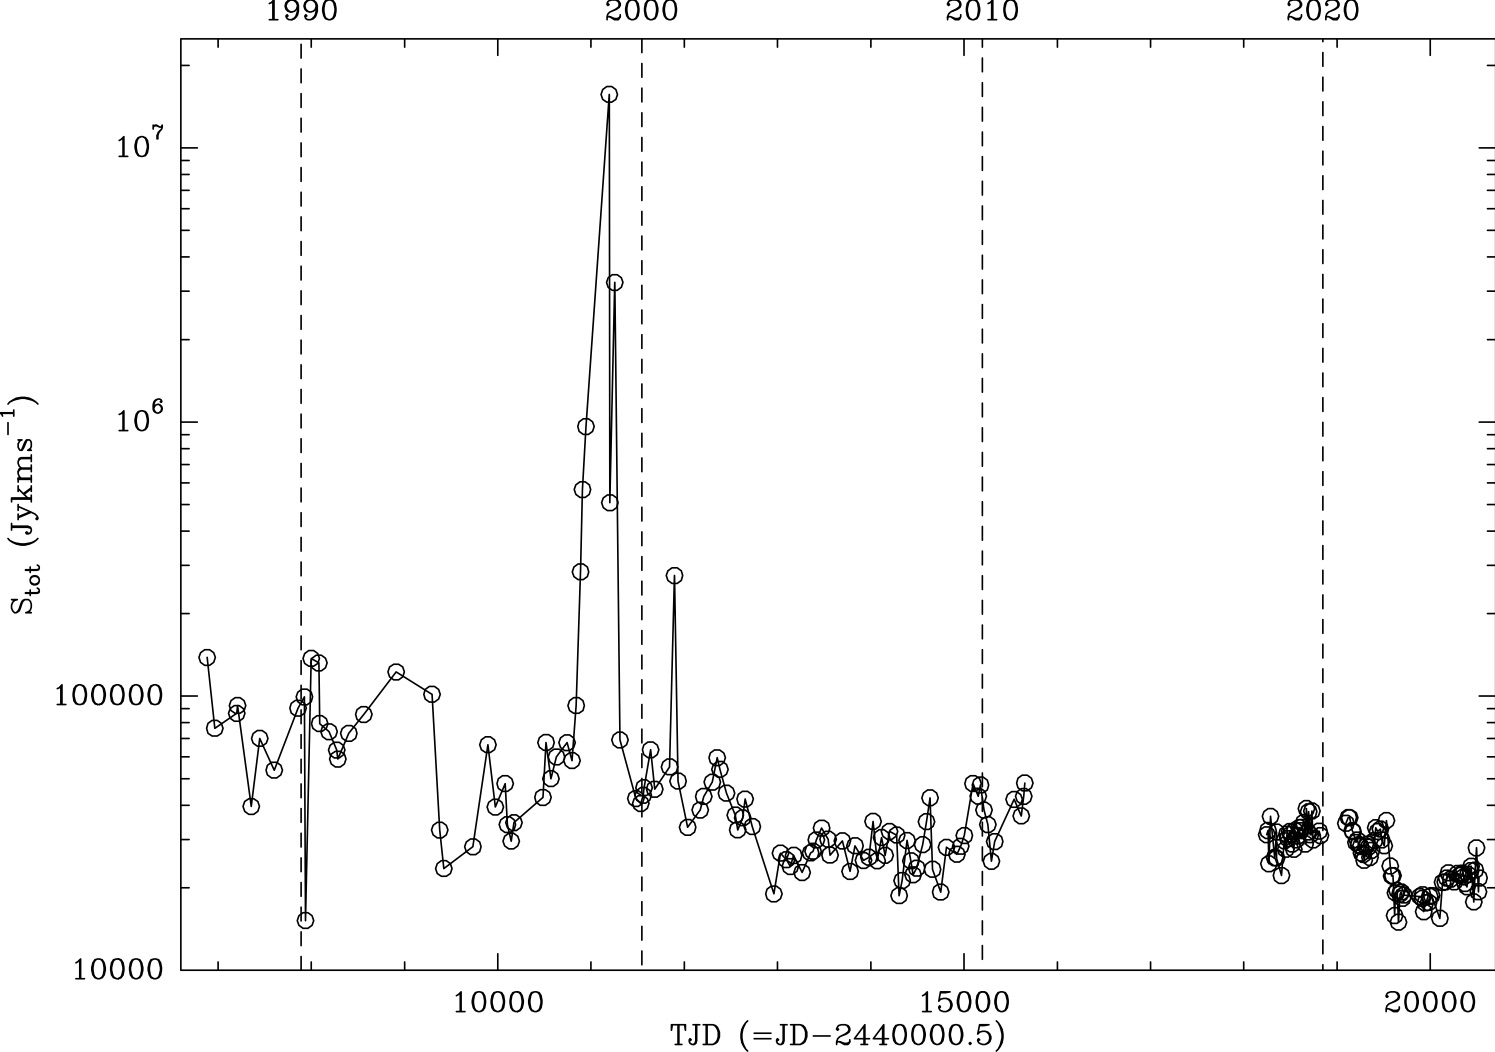
Integrated flux density versus TJD (days) for emission between -20 and 40 km/s for the Orion-KL irc2 water maser. The time period shown is March 1987 to March 2024.