RXJ 1716+67
RXJ 1716+6708
The images below show the z = 0.81 NEP cluster, RXJ1716+6708,
observed at different wavelengths
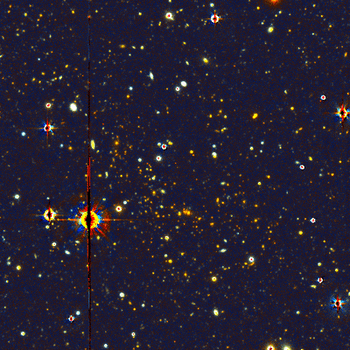
3-color image

RXJ1716+6708 is a morphologically complex cluster whose
3 color image (shown to the left) was obtained by
Clowe et al. 2000.
The image has a size of 5.9' x 5.9' (Omega=1, q0=0.5, H0 = 100 km s-1 Mpc-1).
The R, G, and B colors are a 26,100 s I-band exposure from the UH 88"
telescope, a 7500 s R-band exposure from the Keck II telescope, and a 10 800 s
B-band exposure from the UH 88" telescope, respectively. All three colors are
scaled with a log ^(1/2) stretch. The cD alaxy is located in the
lower center of the image, with a long filament leading out of the cluster to
the northeast.
Galaxies with spectroscopic redshifts

Four slit-masks were produced for observations on the Keck-II telescope
equipped with LRIS (Oke et al. 1995).
Cluster galaxies extend up to the north-east corner
in an inverted S-shape which gives the cluster a filamentary appearance
(see Gioia et al. 1999
for a complete description).
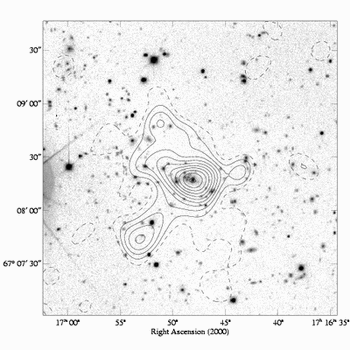
There are 37 cluster galaxies with spectroscopic redshifts which are indicated
in the image to the left. The cluster has a high velocity dispersion
Sigma_V = 1522 (+215,-140) km s-1, which is a signature of non-virialization.
RXJ1716 may be an example of cluster which has not reached virial
equilibrium, its dynamical state may be in large part dominated by
infall or merging and consequently the velocity dispersion is not
representative of the virial temperature of the cluster. If the cluster is
actually composed of two or more distinct gravitational components
the situation should be apparent from the velocity histogram (which
is Gaussian),
unless the separation of the cluster components is so small to be
statistically of little significance. The high value of the
velocity dispersion can be due to a number of causes.
If there is any fraction of infalling galaxies which are bound to the
cluster but not yet virialized, they could inflate the velocity
dispersion. It might well be that galaxies are infalling towards the
center of the cluster, and while some galaxies have already reached
(or crossed) the core region, some others are still moving along
radial orbits towards its center.
ROSAT HRI emission

X-ray observations were obtained with the ROSAT High Resolution
Imager (HRI) in a single pointing in May 1997,
for a net live time of 18Ks (Gioia et
al. 1999). The HRI image to the left reveals that
RXJ1716 is morphologically complex at X-ray wavelengths too. The emission
is clearly extended over a scale of roughly 1 arcmin (which corresponds
to ~500 kpc with H0=50 km s -1 Mpc -1), and its shape is indicative of the
non-regularity of this cluster.
While the strongest emission originates from an almost circular peak
whose location is consistent with the position of the cD, the lower flux
contours show a pronounced centroid shift and become significantly
elongated in the same north-east south-west direction as the distribution
of the galaxies. The faint source about 50 arcsec to the SE of the cluster
centre is most likely not related to the cluster. The elongated shape
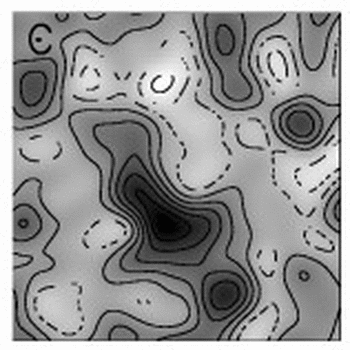
of the emission coincides qualitatively with the dark matter contours
determined by Clowe et al. (1998) and shown in the image below.
From the X-ray data a mass equal to (2.8 +/- 0.3) x 10^(14) h_(50)^(-1) M_sun
is derived. However, one should bear in mind that the mass determined using
X-ray data does depend on assumptions
involving spherical symmetry and hydrostatic equilibrium,
thus some of the assumptions may not apply in this case.
Weak Lensing Mass Reconstruction

The total mass derived from X-rays data is very similar to the mass derived
from the gravitational shear signal by
Clowe et al. (1998) . These authors
find in roughly the same region a value of (5.2+/-1.8) x 10^(14)
h_(50)^(-1) M_sun. The weak lensing mass is computed assuming the
background galaxies lie on a sheet at z = 2 and is higher, even
within the uncertainties, than the X-ray derived mass. We note however
that the Clowe et al. (1998) mass determination takes into account
also the second clump of matter associated with the NE group of galaxies
which is clearly separated in their mass distribution map from the main
cluster mass. The X-ray gravitational mass comes only from the main
optical clump centered on the cD. In addition
the weak lensing center of mass of the main cluster is displaced with
respect to the center of the light and X-ray peaks of the cluster;
it is located 27" east and 11" north of the cD, but still consistent
within the uncertainties of the weak lensing positions. The weak lensing
mass distribution also resembles a filament of structure elongated in the
same direction as the chain of optical galaxies.
Updated: June 2007


