
At present there are two main models which try to
explain the correlation observed.
In a jet flow accelerating as its internal energy is converted into
bulk flow energy (Maraschi et al. 1992, Marscher 1993), the synchrotron
emission at UV, optical and IR frequencies is confined to the region closest
to the central engine, opaque to the radio emission. The radio emission
is then produced outside this region, with the maximum intensity occurring
where the Lorentz factor is highest. Self-Compton scattered
gamma- and X-rays would therefore be produced in coincidence with the
synchrotron emission at high and low energies. Moreover Inverse Compton
reflection of optical and UV photons produced by the accretion disk would
take place in the vicinity of the central engine, producing again X- and
gamma-ray emission.
In a model consisting of a decelerating flow of relativistic positrons
and electrons (Melia and Konigl 1989, Marscher 1993) the UV photons produced
by the accreation disk are upscattered to X- and gamma ray energies. Radio
and infrared synchrotron emission (plus self-Compton scattered X- and gamma-ray
emission) is produced where the Lorentz factor decreases down to a value
of ~10.
The behaviour of the energy bursts detected, i.e. how they begin, evolve and propagate to low frequencies, is very important to discriminate between the proposed models. The timescale of the flux density variations is strictly related to the size of the emitting region, thus observations of correlated variability and time delays should reveal the relative location of non-thermal emission at the various frequencies. For this reason, multifrequency observations of blazars, from gamma- and Xray regimes down to radio frequencies are particularly important.
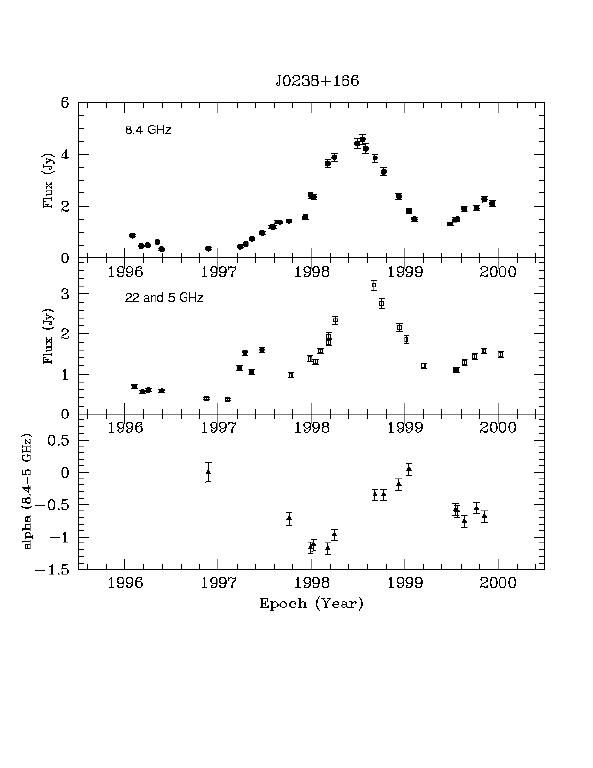
From January 1996 to January 2000
we carried out continuum radio monitoring observations of a
sample of blazars (the Medicina sample), which are also under
study at X-ray energies with the satellite SAX and in the optical band.
Most of the sources in our list
are BL-Lac type objects, however high polarisation and low polarisation
quasars are also included.
The sources in our list are the following:
Name
RA (1950) DEC (1950)
0048-097 00 48 09.99
-09 45 24.6
0235+165 02 35 52.62
+16 24 04.0
0528+134 0528 06.75
+13 29 42.6
0735+178 07 35 14.13
+17 49 09.3
0716+714 07 16 12.98
+71 26 15.0
0836+710 08 51 57.25
+20 17 58.4
0954+658 09 54 57.86
+65 48 15.5
1101+384 11 01 40.10
+38 28 51.0
1226+023 12 26 33.25
+02 19 43.2
1253-055 12 53 35.84 -05
31 08.0
1418+546 14 18 06.20
+54 36 57.8
1510-089 15 10 08.92 -08
54 48.0
1652+398 16 52 11.75
+39 50 24.6
1749+096 17 49 10.39
+09 39 42.7
1749+701 17 49 03.38
+70 06 39.5
1803+784 18 03 39.18
+78 27 54.2
1807+698 18 07 18.54
+69 48 57.0
1823+568 20 07 20.42
+77 43 58.0
2200+420 22 00 39.36
+42 02 08.6
2230+114 22 30 07.81
+11 28 22.7
2251+158 22 51 29.52
+15 52 54.3
Our monitoring program was carried out with the 32m
VLBI antennas located in Medicina (Bologna) and Noto (Siracusa) at 8.4
GHz and 5 GHz . The observations were done on monthly basis at both
frequencies.
Left and right circular polarization are recorded simultaneously at
both frequencies, and the flux density measurements are combined after
the data reduction. The error on the flux density measurements is
~4% at both frequencies in both polarizations.